Estimating Age Using Nationwide Survey Data on the Number of Residual Teeth
Article information

Trans Abstract
Given that tooth loss is a degenerative change, the number of residual teeth may be used to specify a particular age range as a marker for age estimation. This study examined changes in the number of teeth with age using a nationwide oral survey database and derived the age distribution of the Korean population according to the number of teeth. Data on the number of teeth and age were extracted from the oral examination data of the Korean National Health and Nutrition Examination Survey (KNHANES) from 2016 to 2018. Statistical analyses of a complex sample survey were performed using weighted values. The distribution range of the number of teeth by age was broad. The proportion of young people decreased progressively as the number of remaining teeth decreased. In contrast, the proportion of those from the older age group decreased slightly as the number of teeth increased. The number of teeth was subdivided into groups of four, age was categorized into 5-year intervals, and the distribution of age groups by the number of teeth was analyzed. We attempted to determine the age group threshold at approximately 95th percentile for age. In summary, we found that if there were ≤4, 5-12, and 13-20 residual teeth, the estimated age was ≥60, ≥55, and ≥50 years, respectively, with an approximately 95% probability. When many teeth are lost and it is difficult to apply conventional dental age estimation methods, our method may assist in narrowing the age range, although it is not an accurate age determination method.
Introduction
Dental age estimation is frequently studied in forensic dentistry [1]. Dental age is estimated using different approaches for adults and children. In children and adolescents, age is accurately determined using the developmental stages of teeth [2,3]. Multiple methods for dental age estimation have been introduced for various ethnic groups [4,5]. In addition to tooth developmental stages, skeletal markers can also be used to obtain accurate age estimations [6]. In adults, age is estimated from degenerative changes in teeth (e.g., secondary dentin deposition, root transparency, attrition, and cementum deposition) [7]. These dental markers have been used in various age-estimation methods [8–10]. Recent studies have used non-invasive dental radiographs, including three-dimensional computed tomography, to measure pulp and tooth volumes for age estimation [11].
For an unidentified adult body, where many teeth are lost or no teeth are present, conventional age estimation methods have limited applications. Tooth loss generally increases with age [12–14] and tooth loss can be considered a degenerative body change. The number of lost (or residual) teeth may provide a means for age estimation. This study examined the distribution of age according to the number of residual teeth using Korean nationwide survey data and determined whether such data could be used for age range estimation. We derived the age distribution according to the number of residual teeth in the Korean population and used it to determine the age range according to the number of remaining teeth.
Materials and Methods
To identify the age distribution based on the number of teeth, we used data from the Korean National Health and Nutritional Examination Survey (KNHANES), a nationwide cross-sectional survey of the health and nutritional status of non-institutionalized South Korean civilians. The data have been used to establish public health policies, programs, and research. Household units were selected to represent the Korean population, using a stratified multistage cluster probability sampling design. The KNHANES was initiated in 1998 and conducted by the Korea Centers for Disease Control and Prevention. To date, KNHANES phases I (1998), II (2001), III (2005), IV (2007-2009), V (2010-2012), VI (2013-2015), and VII (2016-2018) have been conducted. All participants provided informed consent before participating in the survey and all data were processed anonymously. All KNHANES data are available on the KNHANES website (https://knhanes.cdc.go.kr) [15]. This study was approved by the Institutional Review Board of Chosun University Dental Hospital (approval no. CUDHIRB2005002).
Since KNHANES phase IV, oral examinations have been conducted following the World Health Organization criteria. They are performed by trained dentists, and examination quality is maintained by continuous evaluation of examination consistency before and during the survey [16]. Oral examination data from phases IV through VII are published. This study used data from phase VII (2016 to 2018). Data on the number of residual teeth in adults aged ≥20 years and the age of each participant were documented. Due to the small number of participants aged 80 years and over, there was a risk of personal information exposure. To protect privacy, the KNHANES data do not provide the exact age of participants aged over 79 years.
The distribution of the number of teeth by age was broad. Moreover, the proportion in the younger age group decreased relatively quickly as the number of teeth decreased (Fig. 1). In contrast, the proportion in the older age group decreased slightly as the number of teeth increased. Considering these distribution characteristics, and that the exact ages of participants aged ≥80 years were not available, the regression formula used in other age-estimation research was not applied. Instead, we analyzed the distribution ratio of the age groups based on the number of teeth. When there were specific numbers of teeth, a threshold age group at approximately 95% [17] of the cumulative proportion of the elderly was obtained (i.e., when the number of teeth had a certain value, we calculated the 95 percentile of age). Considering the possibility of error depending on the amount of data and the lack of exact ages for participants aged ≥80 years, the number of teeth was subdivided into groups of four, and age was categorized into 5-year intervals. Of note, those with 25 or more teeth and those older than 80 years were grouped into a single group.
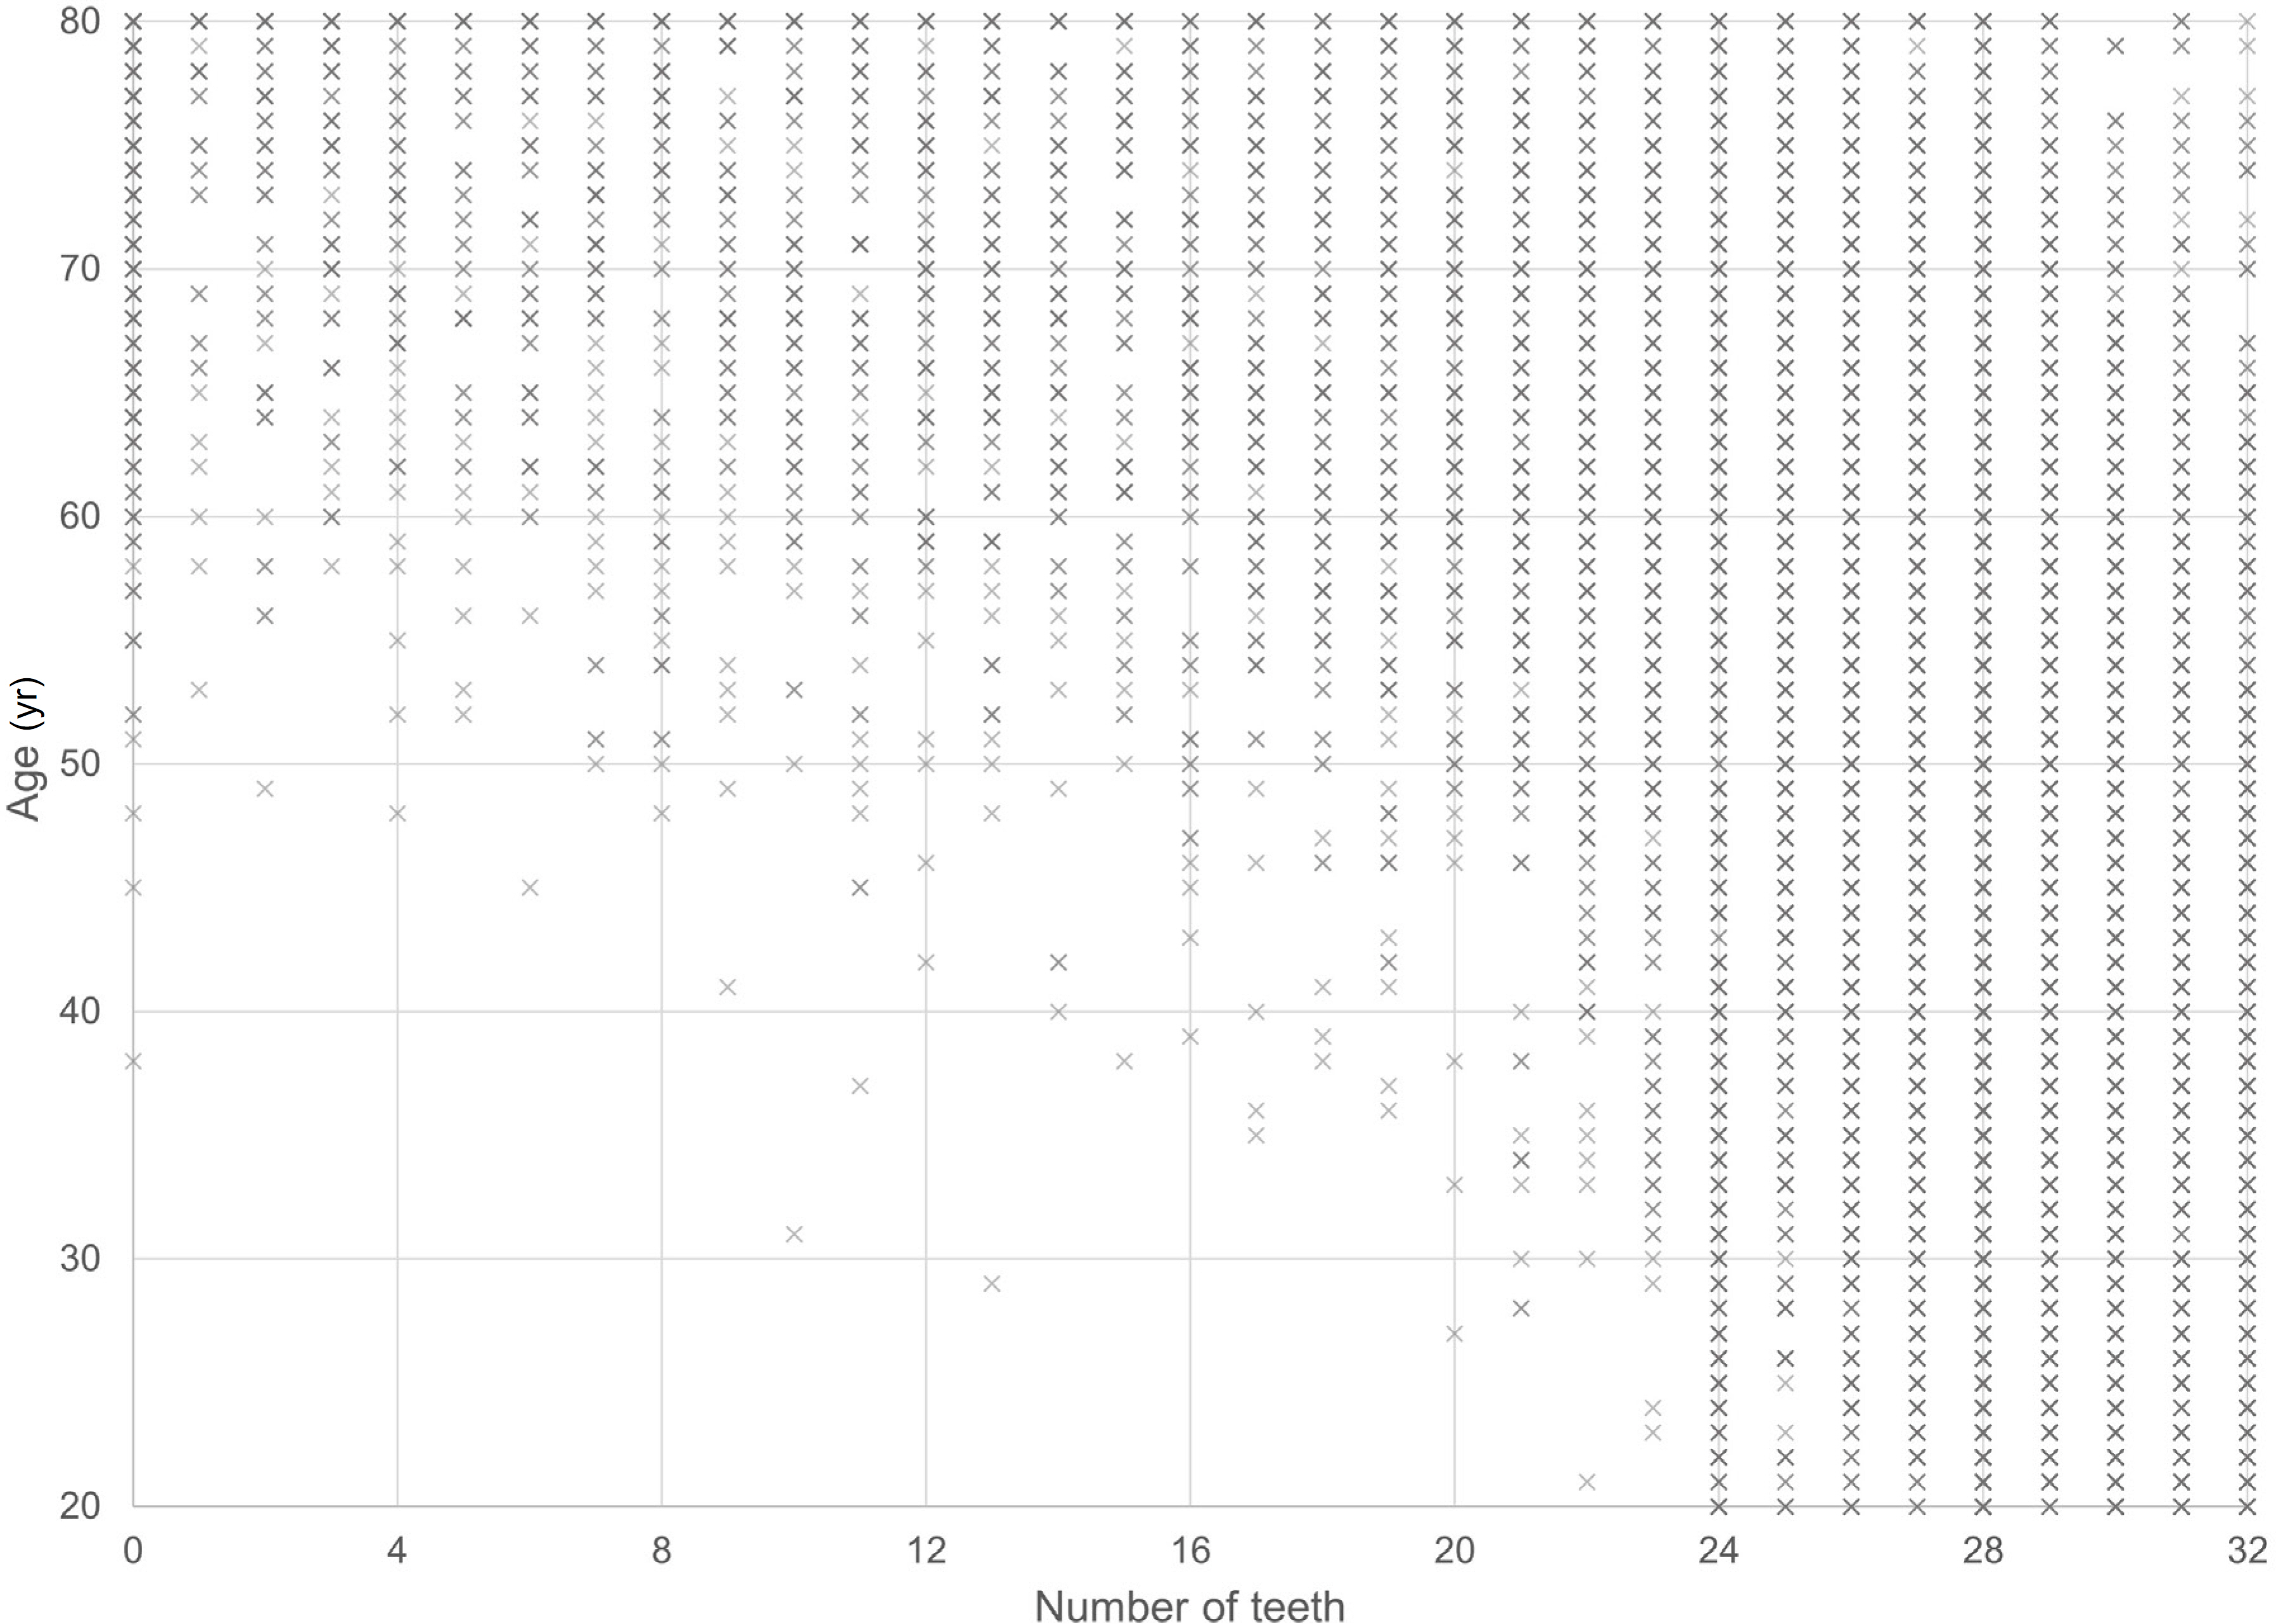
Plot of age and the number of teeth in participants aged ≥20 years in the Korean National Health and Nutrition Examination Survey (KNHANES), 2016 to 2018.
To calculate the distribution in the entire Korean population, statistical analyses were performed considering the survey sampling weights, strata, and primary sampling units. The SPSS complex samples module (SPSS ver. 23.0, IBM, Armonk, NY, USA) was used
Results
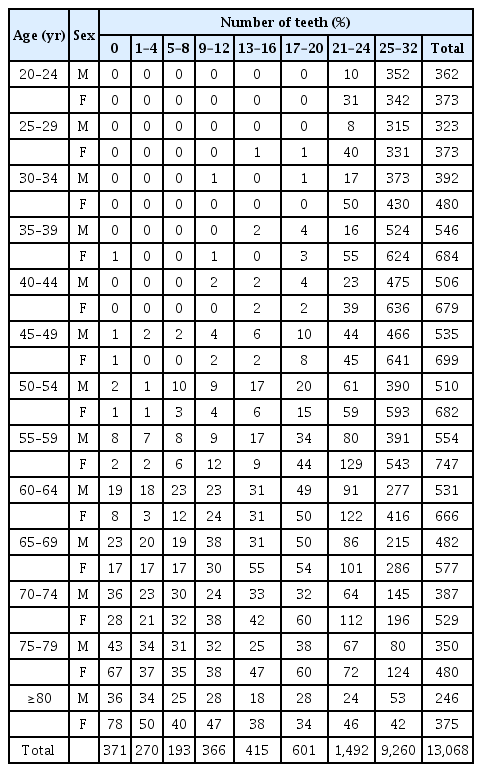
The study included 13,068 participants, aged ≥20 years, from the KNHANES 2016 to 2018 (Table 1). Fig. 1 shows the age distribution according to the number of teeth. When the number of remaining teeth was high, the distribution included participants across all age groups. As the number of teeth decreased, the number of younger participants decreased, and the age distribution was concentrated in the elderly. Table 2 shows the distribution of participants according to the number of teeth and age groups.

Number of participants aged ≥20 years in the Korean National Health and Nutrition Examination Survey (KNHANES) from 2016 to 2018
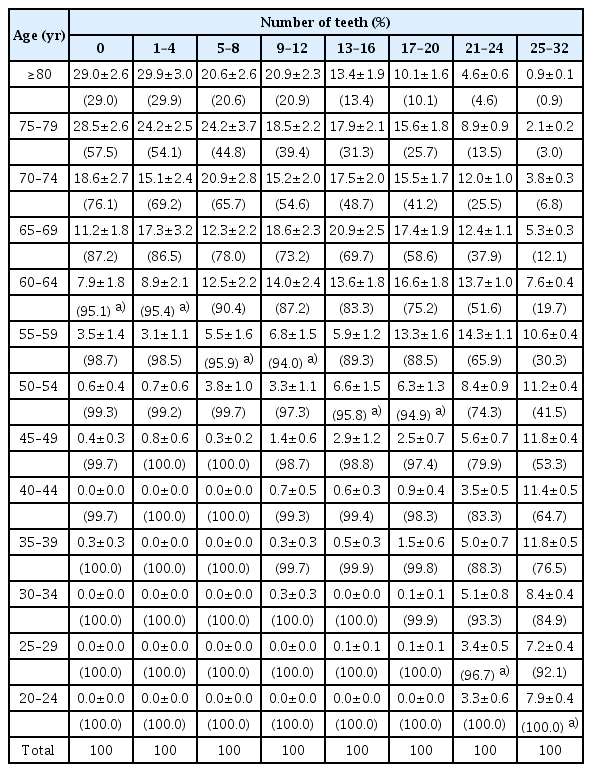
Age distribution by the number of teeth of participants in KNHANES, 2016 to 2018
Tables 3-5 demonstrate the population composition ratio of different age groups and the cumulative proportions of the age groups according to the number of teeth in the entire population group in Korea through a complex sample analysis. The threshold age groups, including around 95% of the entire population from older adults to young adults is as follows. For males, 0, 1-4, and 5-8 teeth corresponded to the age group of 55-59 years; 9-12, 13-16, and 17-20 teeth to the age group 50-54 years; 21-24 teeth to the age group 30-34 years; and 25-32 teeth to the age group 20-24 years. For females, 0 and 1-4 teeth corresponded to the age group 65-69 years; 5-8 teeth to the age group 60-64 years; 13-16 or 17-20 teeth to the age group 55-59 years; 17-20 teeth to the age group 50-54 years; 21-24 teeth to the age group 25-29 years; and 25-32 teeth to the age group 20-24 years. For both sexes, 0 or 1-4 teeth corresponded to the age group 60-64 years; 5-8 or 9-12 teeth to the age group 55-59 years;13-16 and 17-20 teeth to the age group 50-54 years; 21-24 teeth to the age group 25-29 years; and 25-32 teeth to the age group 20-24 years.
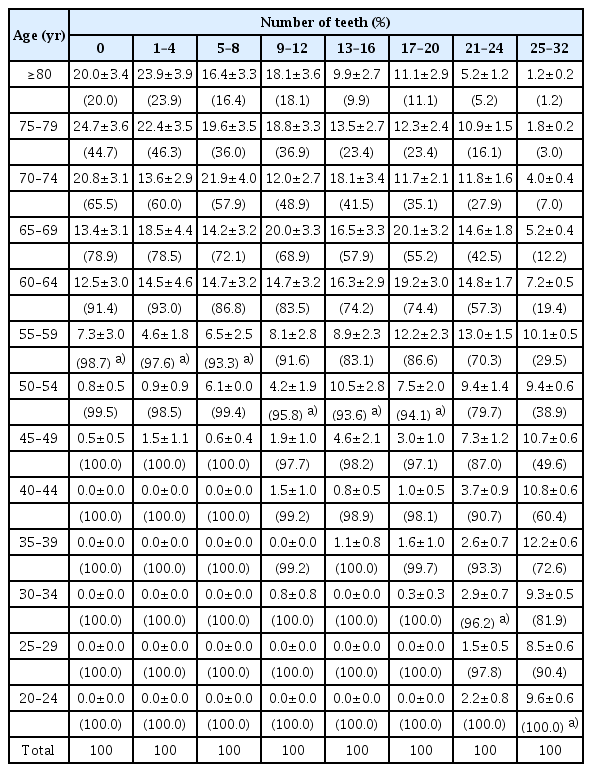
Distribution of age groups according to the number of teeth and cumulative proprotions of elderly in the Korean population aged ≥20 years (male subjects)
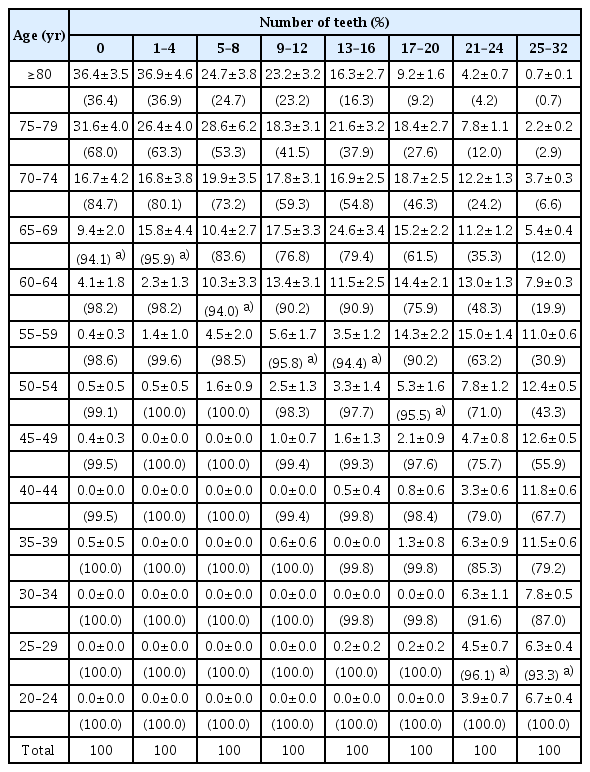
Distribution of age groups according to the number of teeth and cumulative proprotions of elderly in the Korean population aged ≥20 years (female subjects)
Distribution of age groups according to the number of teeth and cumulative proprotions of elderly in the Korean population aged ≥20 years (total subjects)
Based on these values, in males, at 95% probability, 0-8 remaining teeth corresponds to the age of 55 years or older, 9-20 remaining teeth to 50 years or older, 21-24 remaining teeth to 30 years or older, and 25-32 remaining teeth to 20 years or older. In females, at 95% probability, 0-4 remaining teeth corresponds to the age of 65 years or older, 5-8 teeth to 60 years or older, 9-16 teeth to 55 years or older, 17-20 teeth to 50 years or older, 21-24 teeth to 25 years or older, and 25-32 teeth to 20 years or older. For both sexes, 0-4 remaining teeth corresponds to 60 years or older, 5-12 teeth to 55 years or older, 13-20 teeth to 50 years or older, 21-24 teeth to 25 years or older, and 25-32 teeth to 20 years or older.
Discussion
The dental age in adults is usually estimated using the six degenerative changes presented by Gustafson [7]. One, several, or all six markers are usually used for age estimation. These methods should be applied to sound and specific teeth, such as single-rooted teeth [7–9]. If many teeth are lost, the number of available teeth is significantly reduced. With prosthetic treatment, the limitations of existing methods become more marked and dental age estimation becomes almost impossible. When many teeth are lost, people are vaguely assumed to be “old,” but no specific age range has been reported. Our results provide a more specific estimated age range for older adults.
We could not use correlation and regression analyses that are generally conducted in age estimation studies in our study to evaluate the association between age and degenerative changes in the body [7–9]. This is because it was difficult to determine whether the distribution of age by the number of teeth achieved a linear relationship (Fig. 1). Moreover, the available data did not include the exact age of participants aged ≥80 years. Despite that, the nationwide survey data we used was representative of the Korean population.
This study was based on the assumption that tooth loss is a degenerative body change that occurred with age. Many studies have reported a significant increase in tooth loss with age [12–14]. However, various factors are involved in tooth loss, including race, ethnicity, economic and education levels, and medical insurance status [13,14,18–20]. If tooth loss is significantly influenced by demographic and socioeconomic factors, our approach may not be applicable.
South Korea has a homogeneous ethnic population with the people of Korean ethnicity represented as the overwhelming majority (>96%) [21]. South Korea also ranks 11th in nominal gross domestic product worldwide [22], and 22nd in the United Nations Human Development Index, a measure of the extent of the country's inclusive growth. Therefore, the level of social inequality in South Korea is relatively low [23]. Moreover, dental healthcare is very accessible in South Korea [24]. Root canal treatments are covered by the national health insurance, which suggests that conservative dental treatment can be obtained without great difficulty [25]. These factors presumably reduce the ethnic, economic, and social influences on tooth loss in South Korea.
This study attempted to estimate age using nationwide survey data. We considered tooth loss as a marker of degenerative body change. Although our results cannot provide a specific age range for adults in the same way as conventional dental age markers, our results may be used as an alternative when there are many lost teeth, and it is difficult to apply conventional dental age estimation methods.
Notes
Conflicts of Interest
Eui-Joo Kim, a contributing editor of the Korean Journal of Legal Medicine, was not involved in the editorial evaluation or decision to publish this article. All remaining authors declare that there is no conflict of interest.
Acknowledgments
This study was supported by National Forensic Service, Republic of Korea (NFS2022CLI28).